OpenResty XRay
Smart Vital Scanner for Cloud Applications


New release: OpenRestyXRay™ 26.2.1 is now available!See details


A real-time, lightweight, noninvasive monitoring tool that helps you optimize resources and quickly troubleshoot and resolve complex issues.
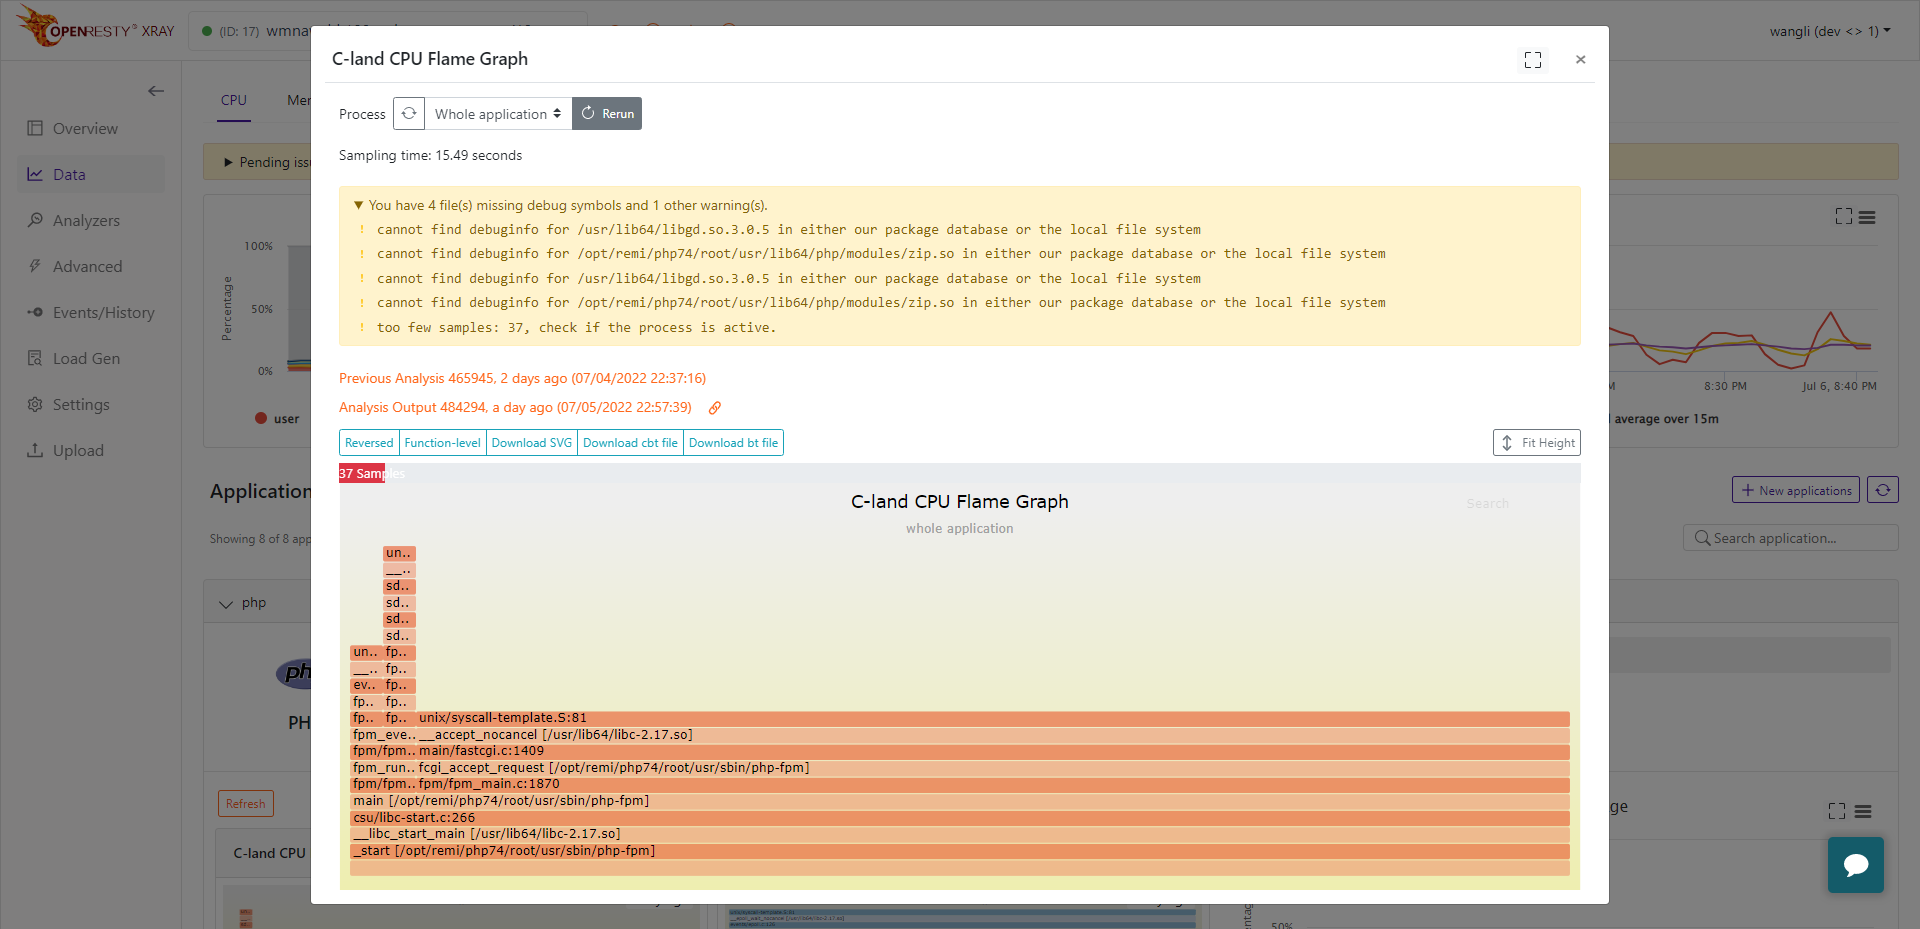
90%
Reduce up to 90% CPU usage
90%
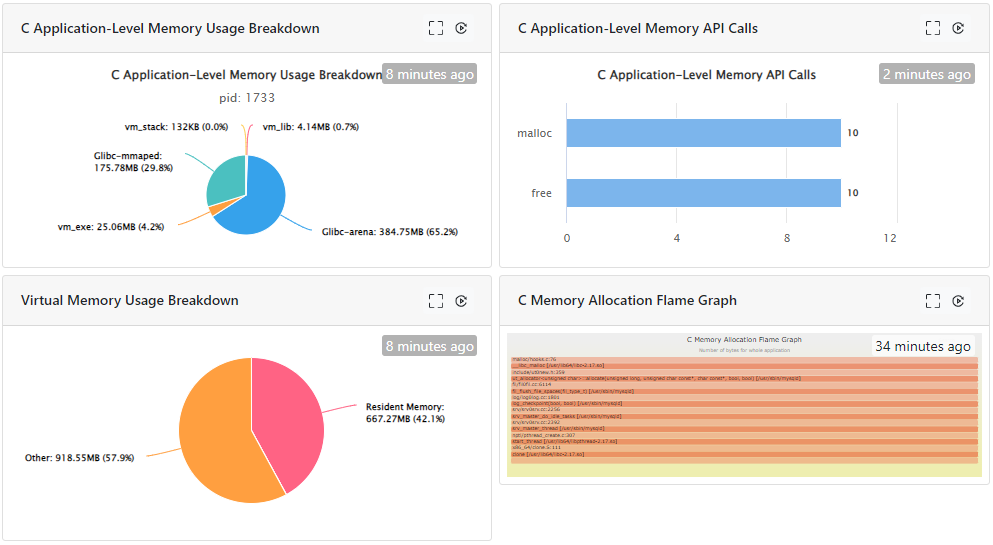
Locate memory leaks in less than 5 mins
80%
Reduce up to 80% disk I/O saturation and latency
90%
Reduce up to 90% network latency and timeout errors
10x
10x concurrency level by resolving locking and blocking issues
Monitor in real time and provide actionable suggestions
Locate the root cause at the code-level granularity
No code will be ever altered or injected; no plug-ins loaded
Scan across boundaries and observe inside the containers
Analyse filtered and aggregated data to reduce storage needed
Detect remote shell execution, injection attempts in real time
Trace code paths and functions that are only relevant
Support developers and DevOps with command-line utilities in development, testing and production environments
Our Tutorials
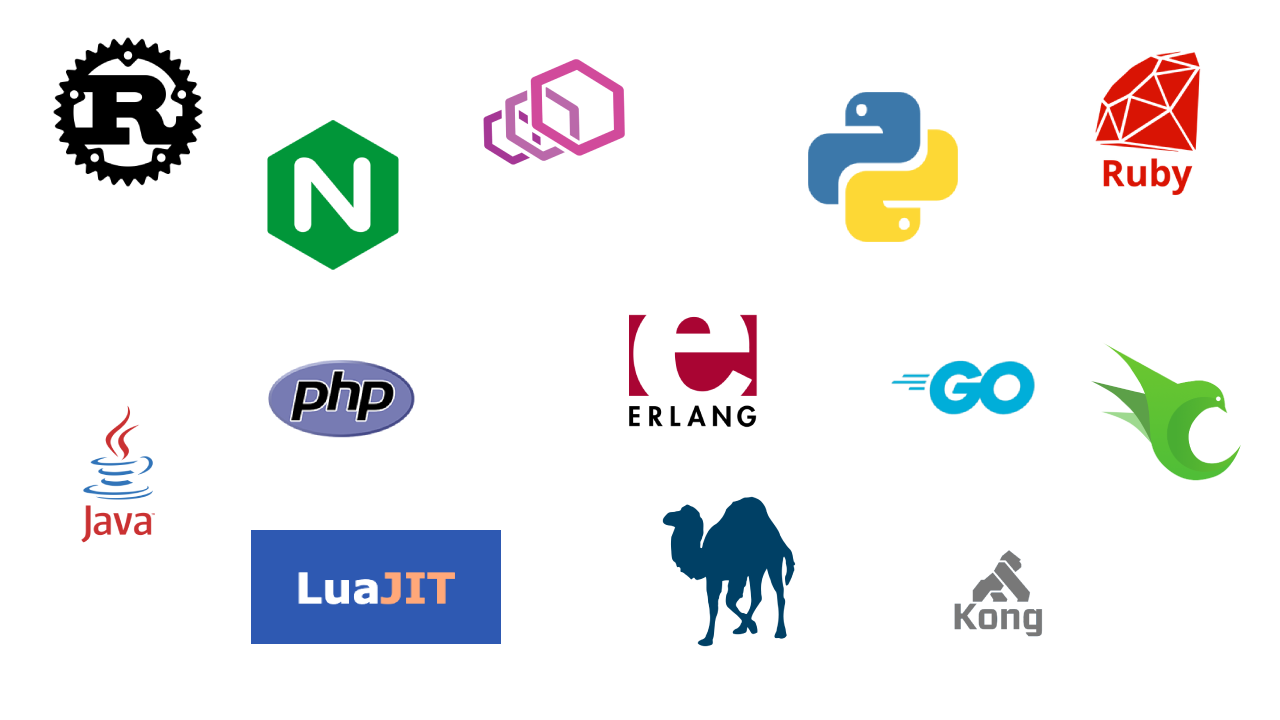
OpenResty XRay provides comprehensive support for mainstream web servers and proxies, including Nginx, Envoy, and Kong. It works seamlessly with various programming languages and runtimes, such as LuaJIT, Python, PHP, Go, Java, Erlang, Perl, Ruby, and Rust. It also extends its capabilities to database systems like Redis, making it a truly versatile analysis tool.

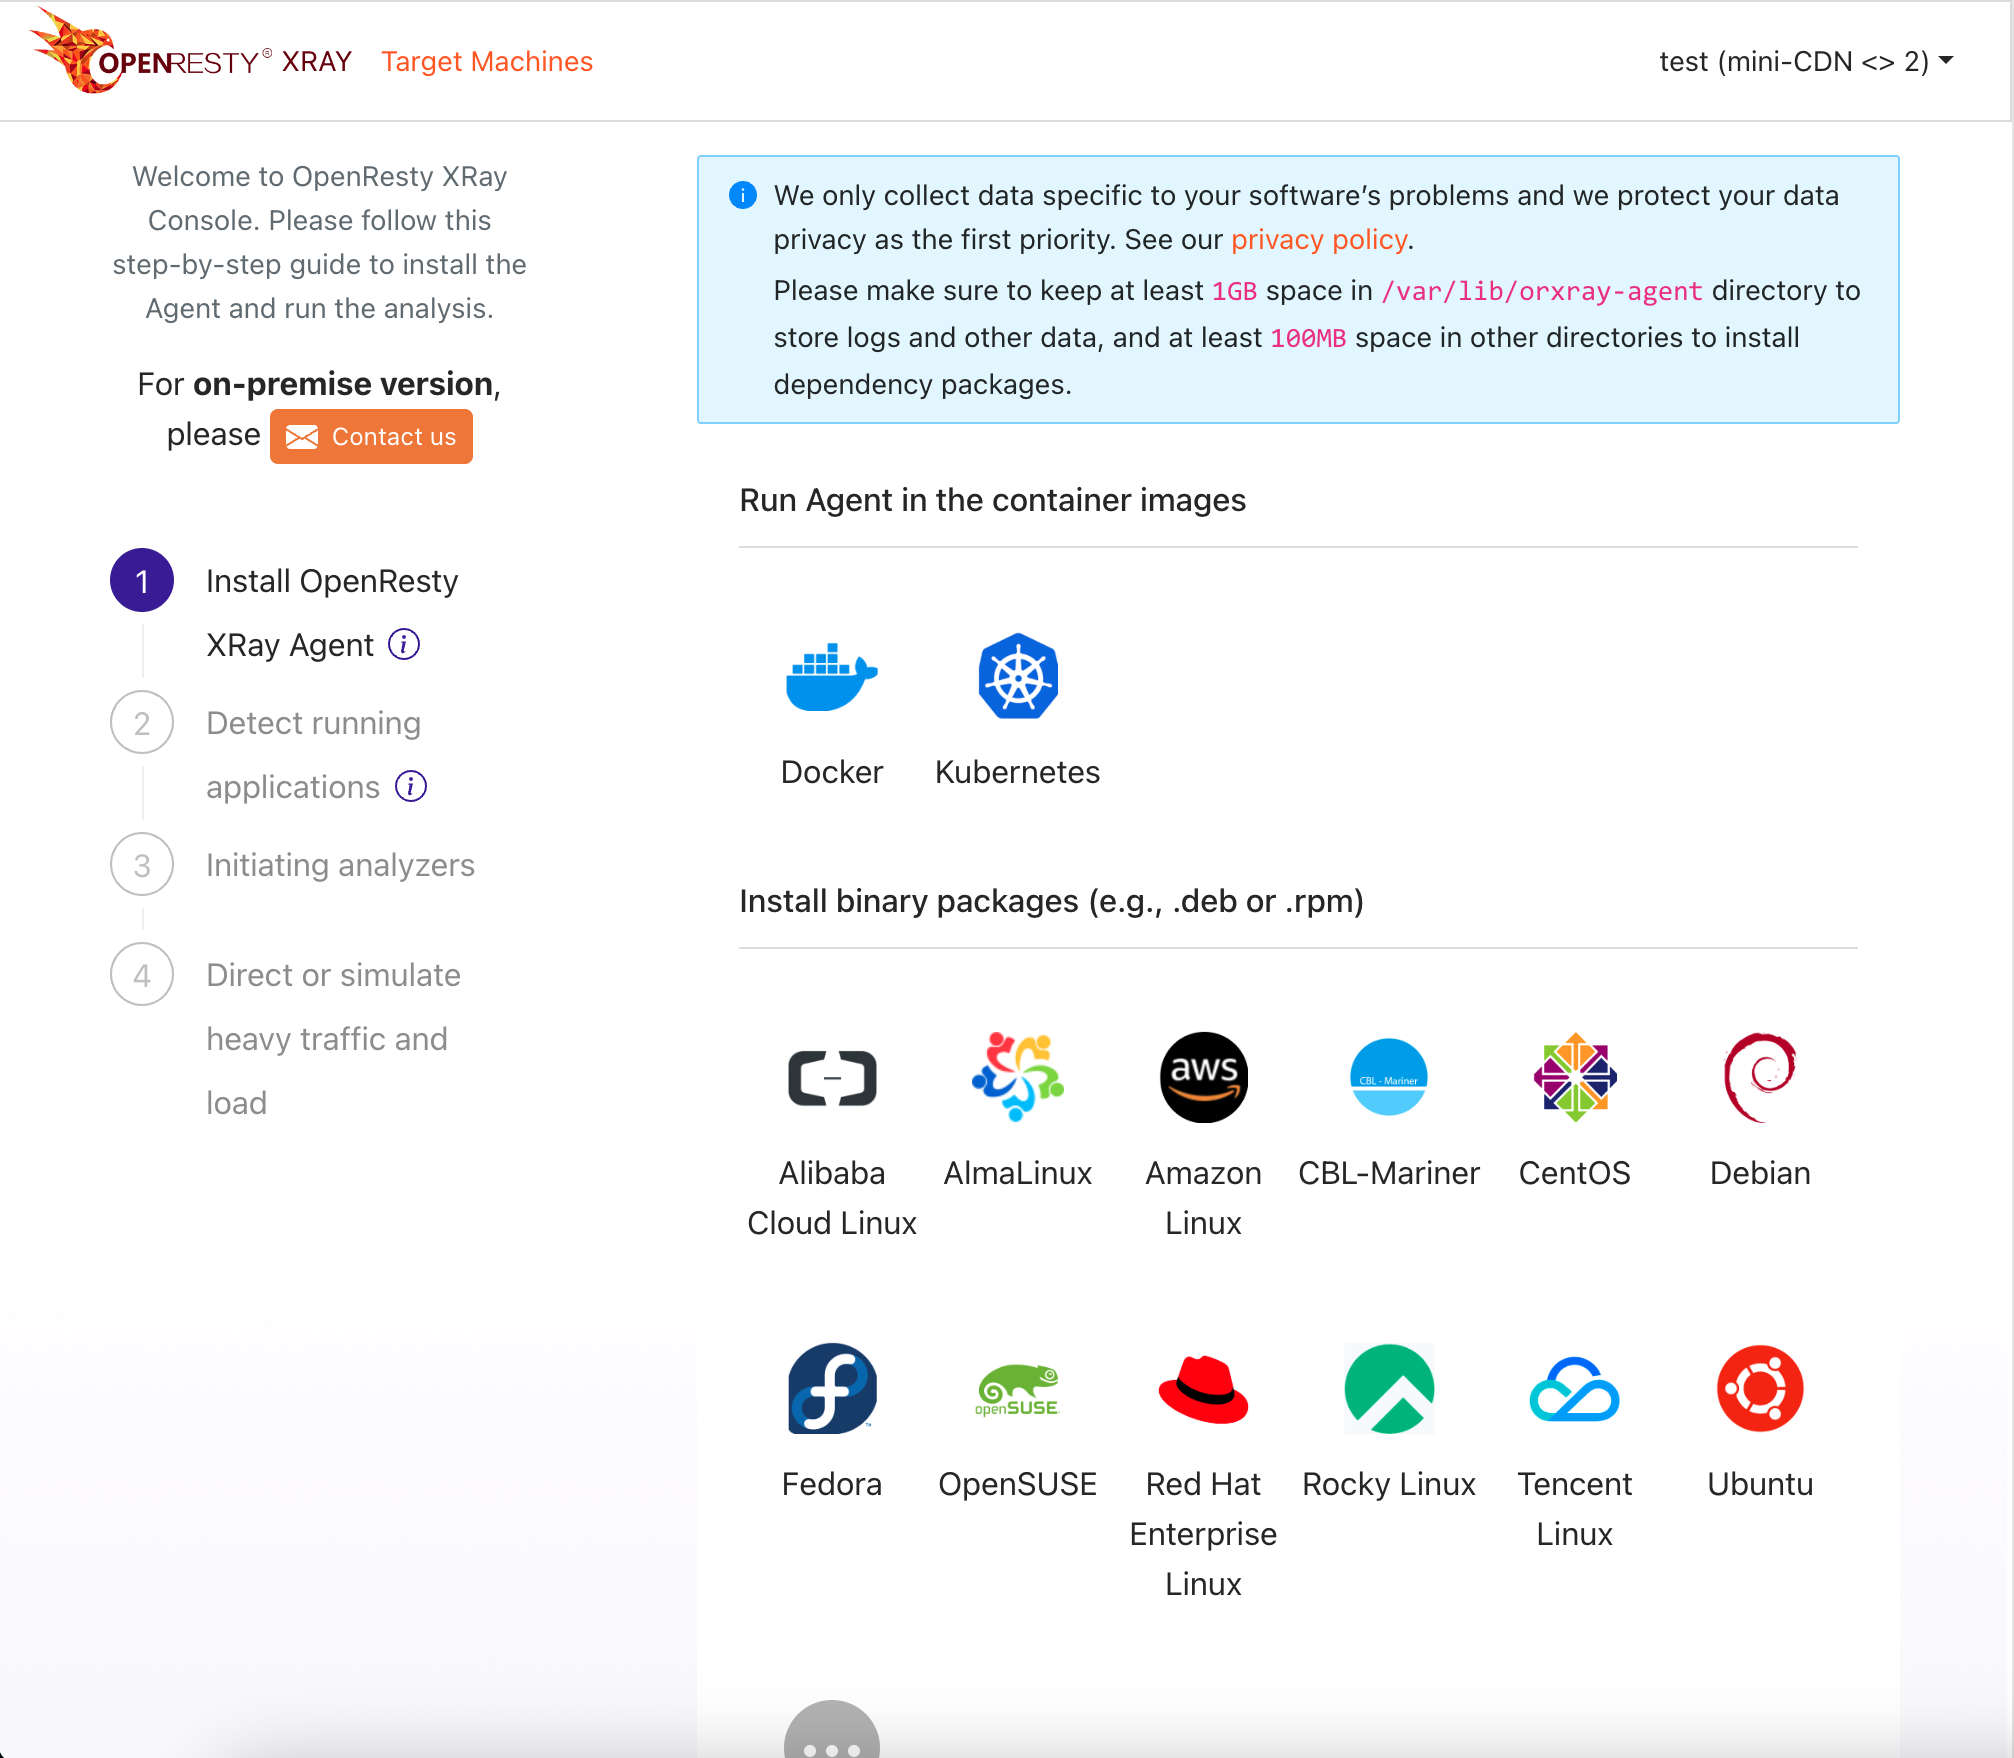
OpenResty XRay provides comprehensive support for popular Linux distributions, including Ubuntu, Debian, Fedora, Red Hat Enterprise Linux (RHEL), CentOS, openSUSE, AlmaLinux, Amazon Linux, Alibaba Cloud Linux, Rocky Linux, Tecent Linux, and Kylin, plus full container deployment capabilities with Docker and Kubernetes.
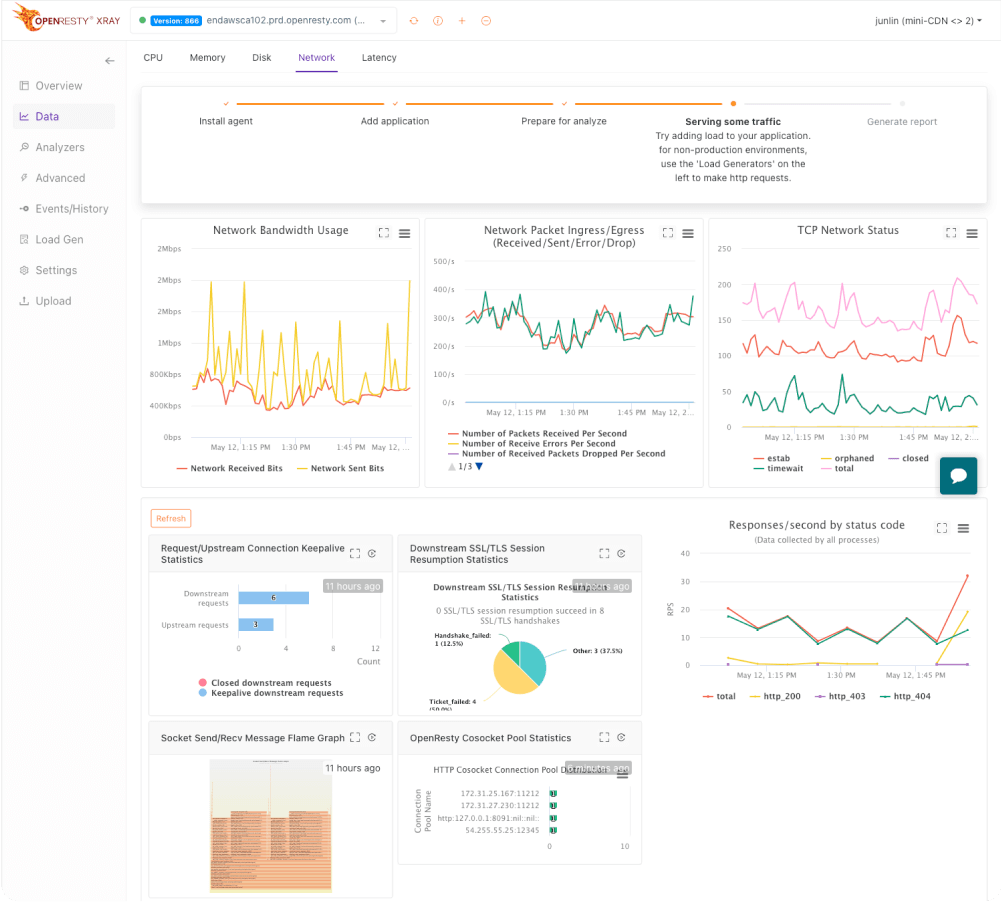
OpenResty XRay shows how hardware resources, such as CPU time, wait time, I/O time, disk throughput, memory, and network bandwidth, are distributed across all code, data reference pathways and software layers in applications.
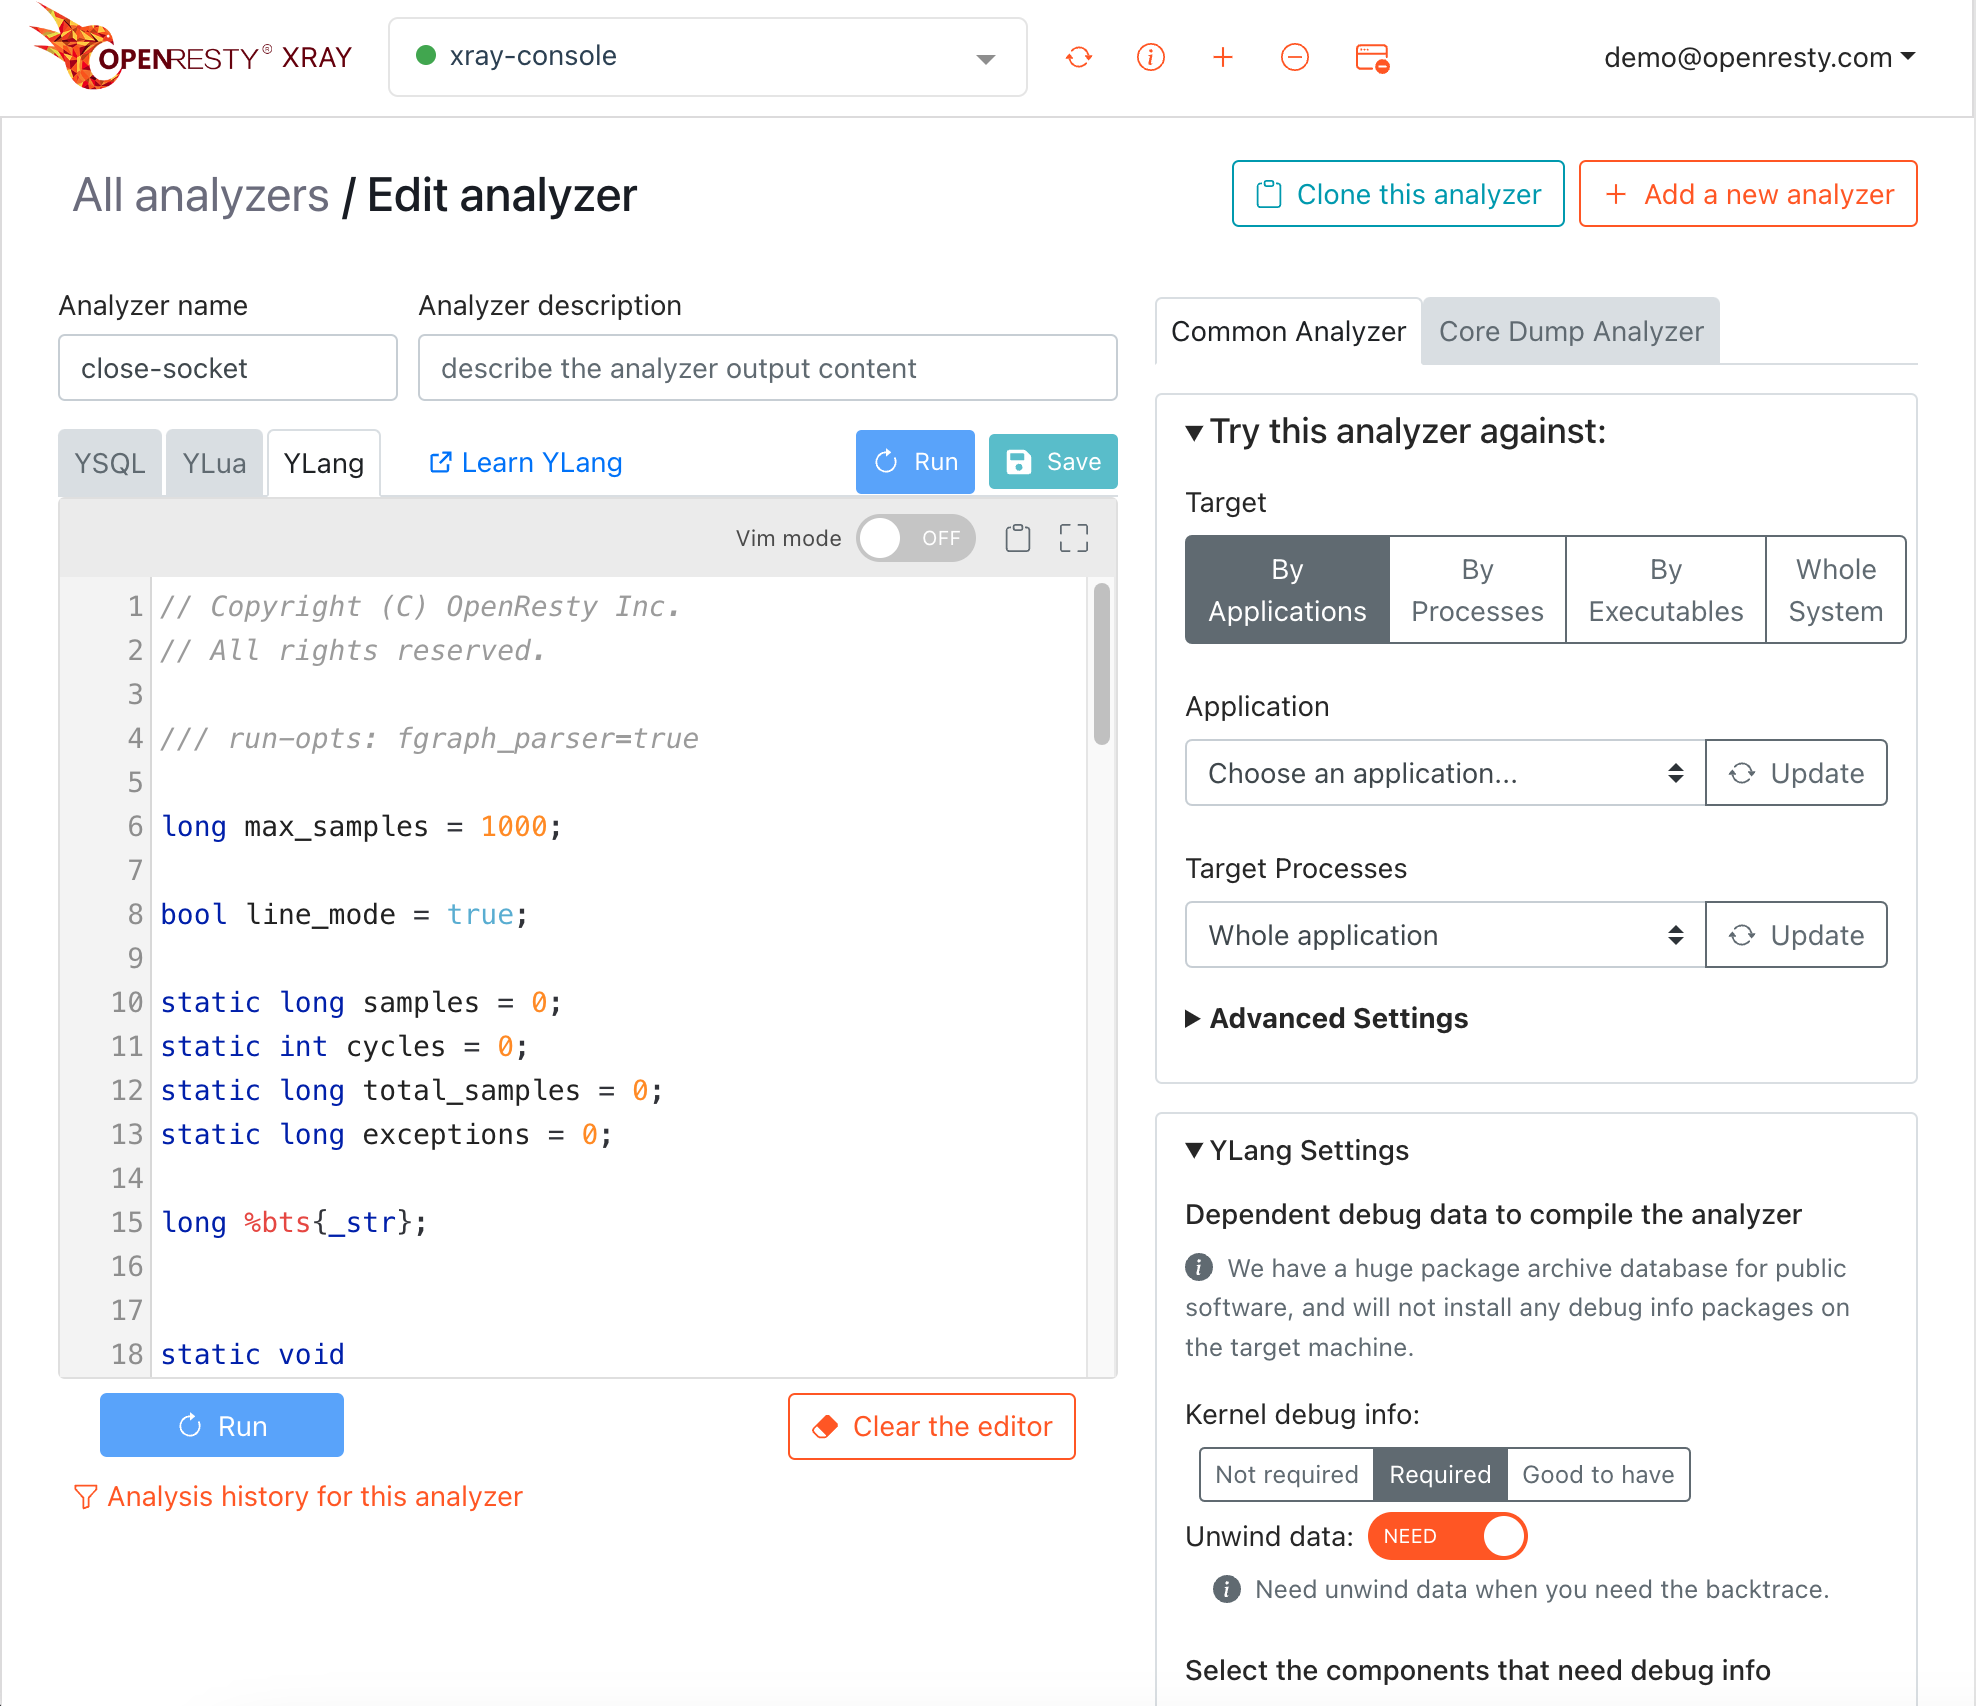
Our solution goes beyond pre-built features. Our dedicated team of experts collaborates with you to identify the exact source of any online issue you encounter. We can even create custom analyzers to address your specific needs.
OpenResty XRay can catch issues that are hard to reproduce even in the production environment, using an extremely low resource consuming and noninvasive approach along with sampling triggered by exception indicators.
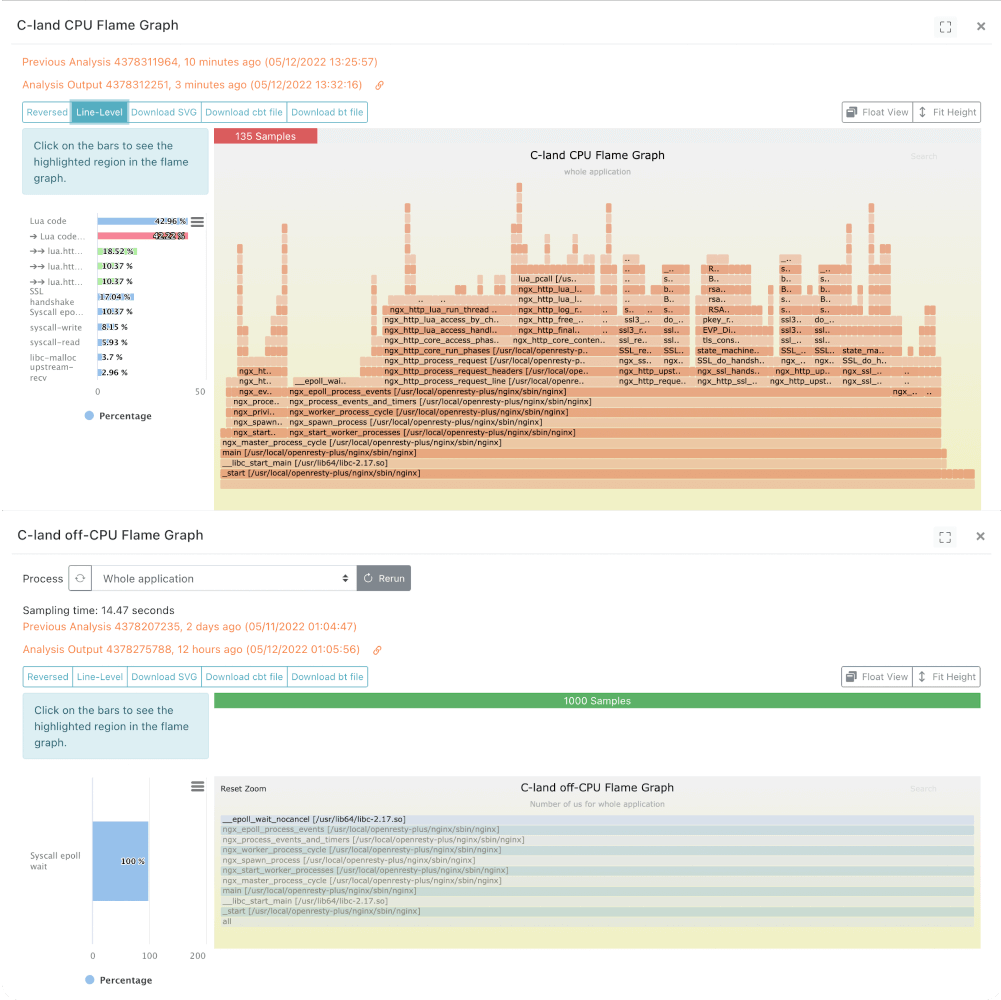
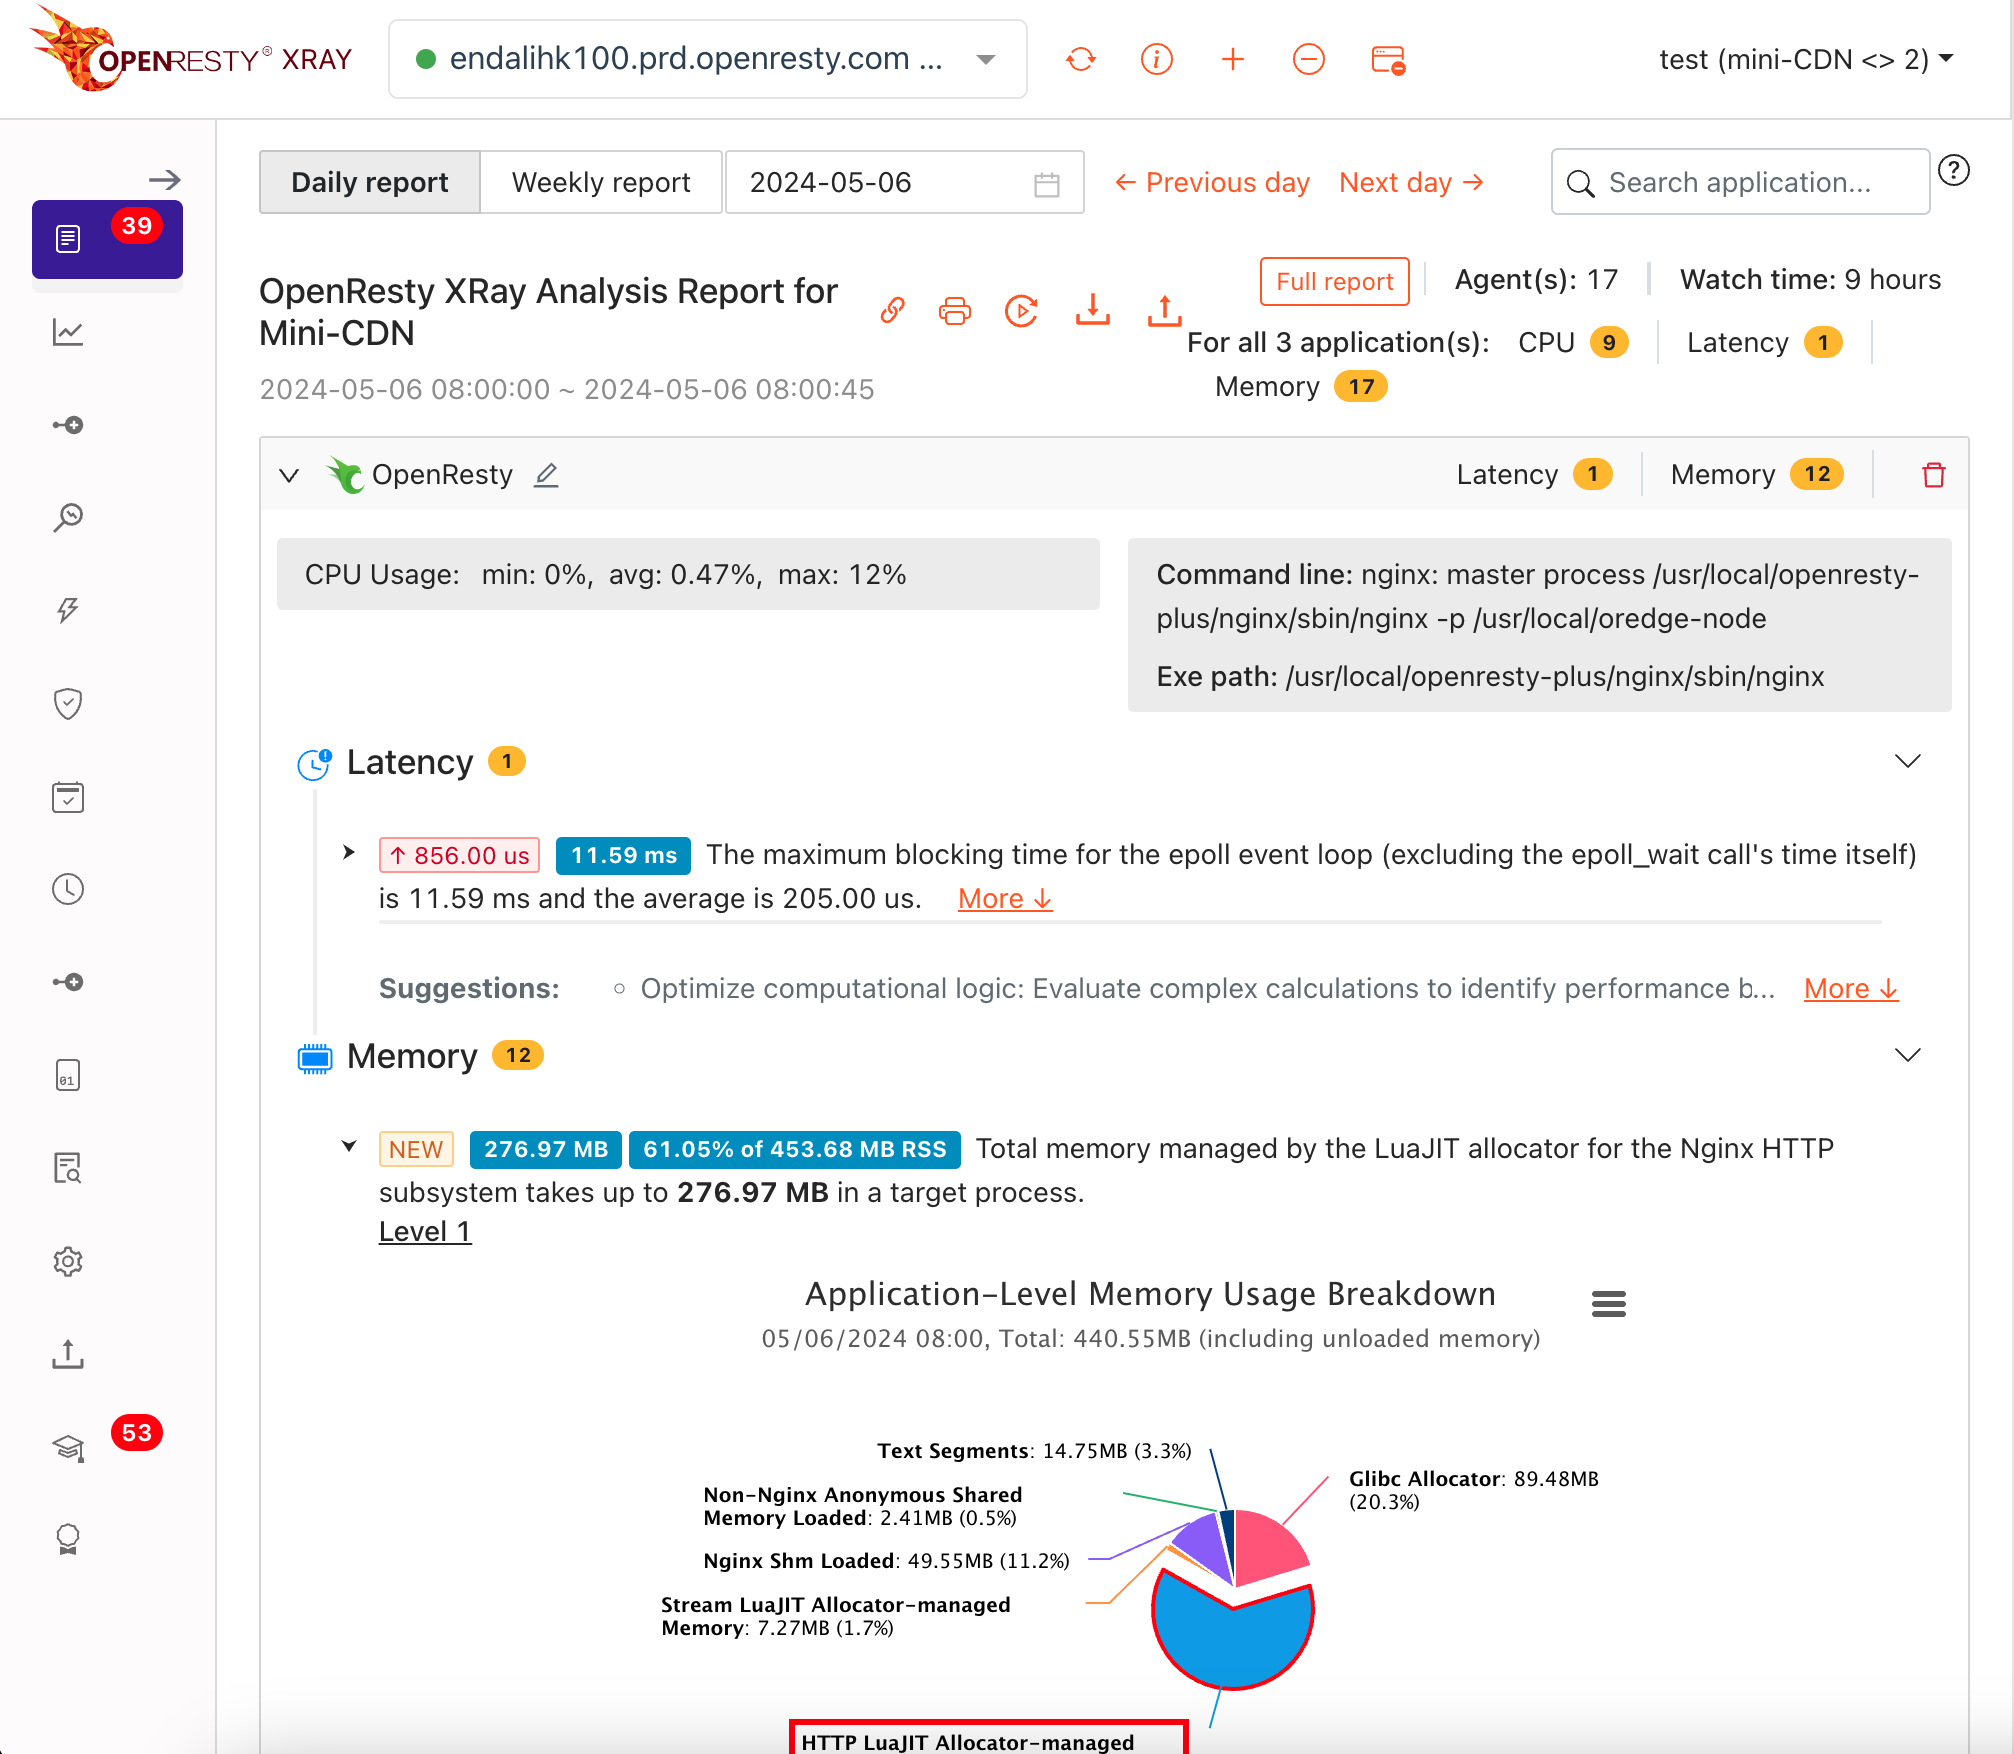
We offer exclusive libraries tackling complex performance challenges and overcoming unmet requirements. We're also open to developing custom code and libraries upon request.
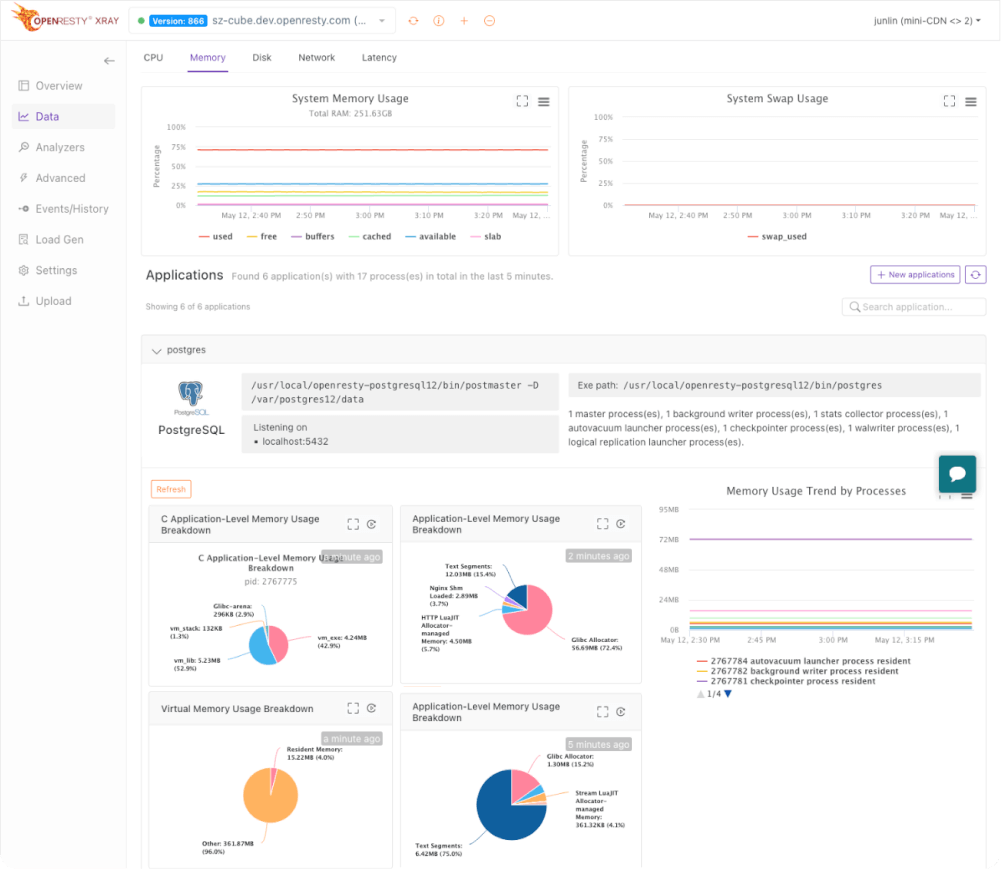
Users can view collected metrics data in OpenResty XRay or export it to other data analytics platforms for visualization.
We understand the need to maintain mission-critical applications on older operating systems like CentOS 6, Ubuntu 14.04 Trusty, and Debian 8 Jessie. OpenResty XRay provides comprehensive support for these systems without disruptive migrations.
OpenResty XRay uses dynamic-tracing technologies to analyze the processes of your running applications. Our advanced machine learning algorithms even enable the analysis of stripped executable binaries without debug symbols or symbol tables.
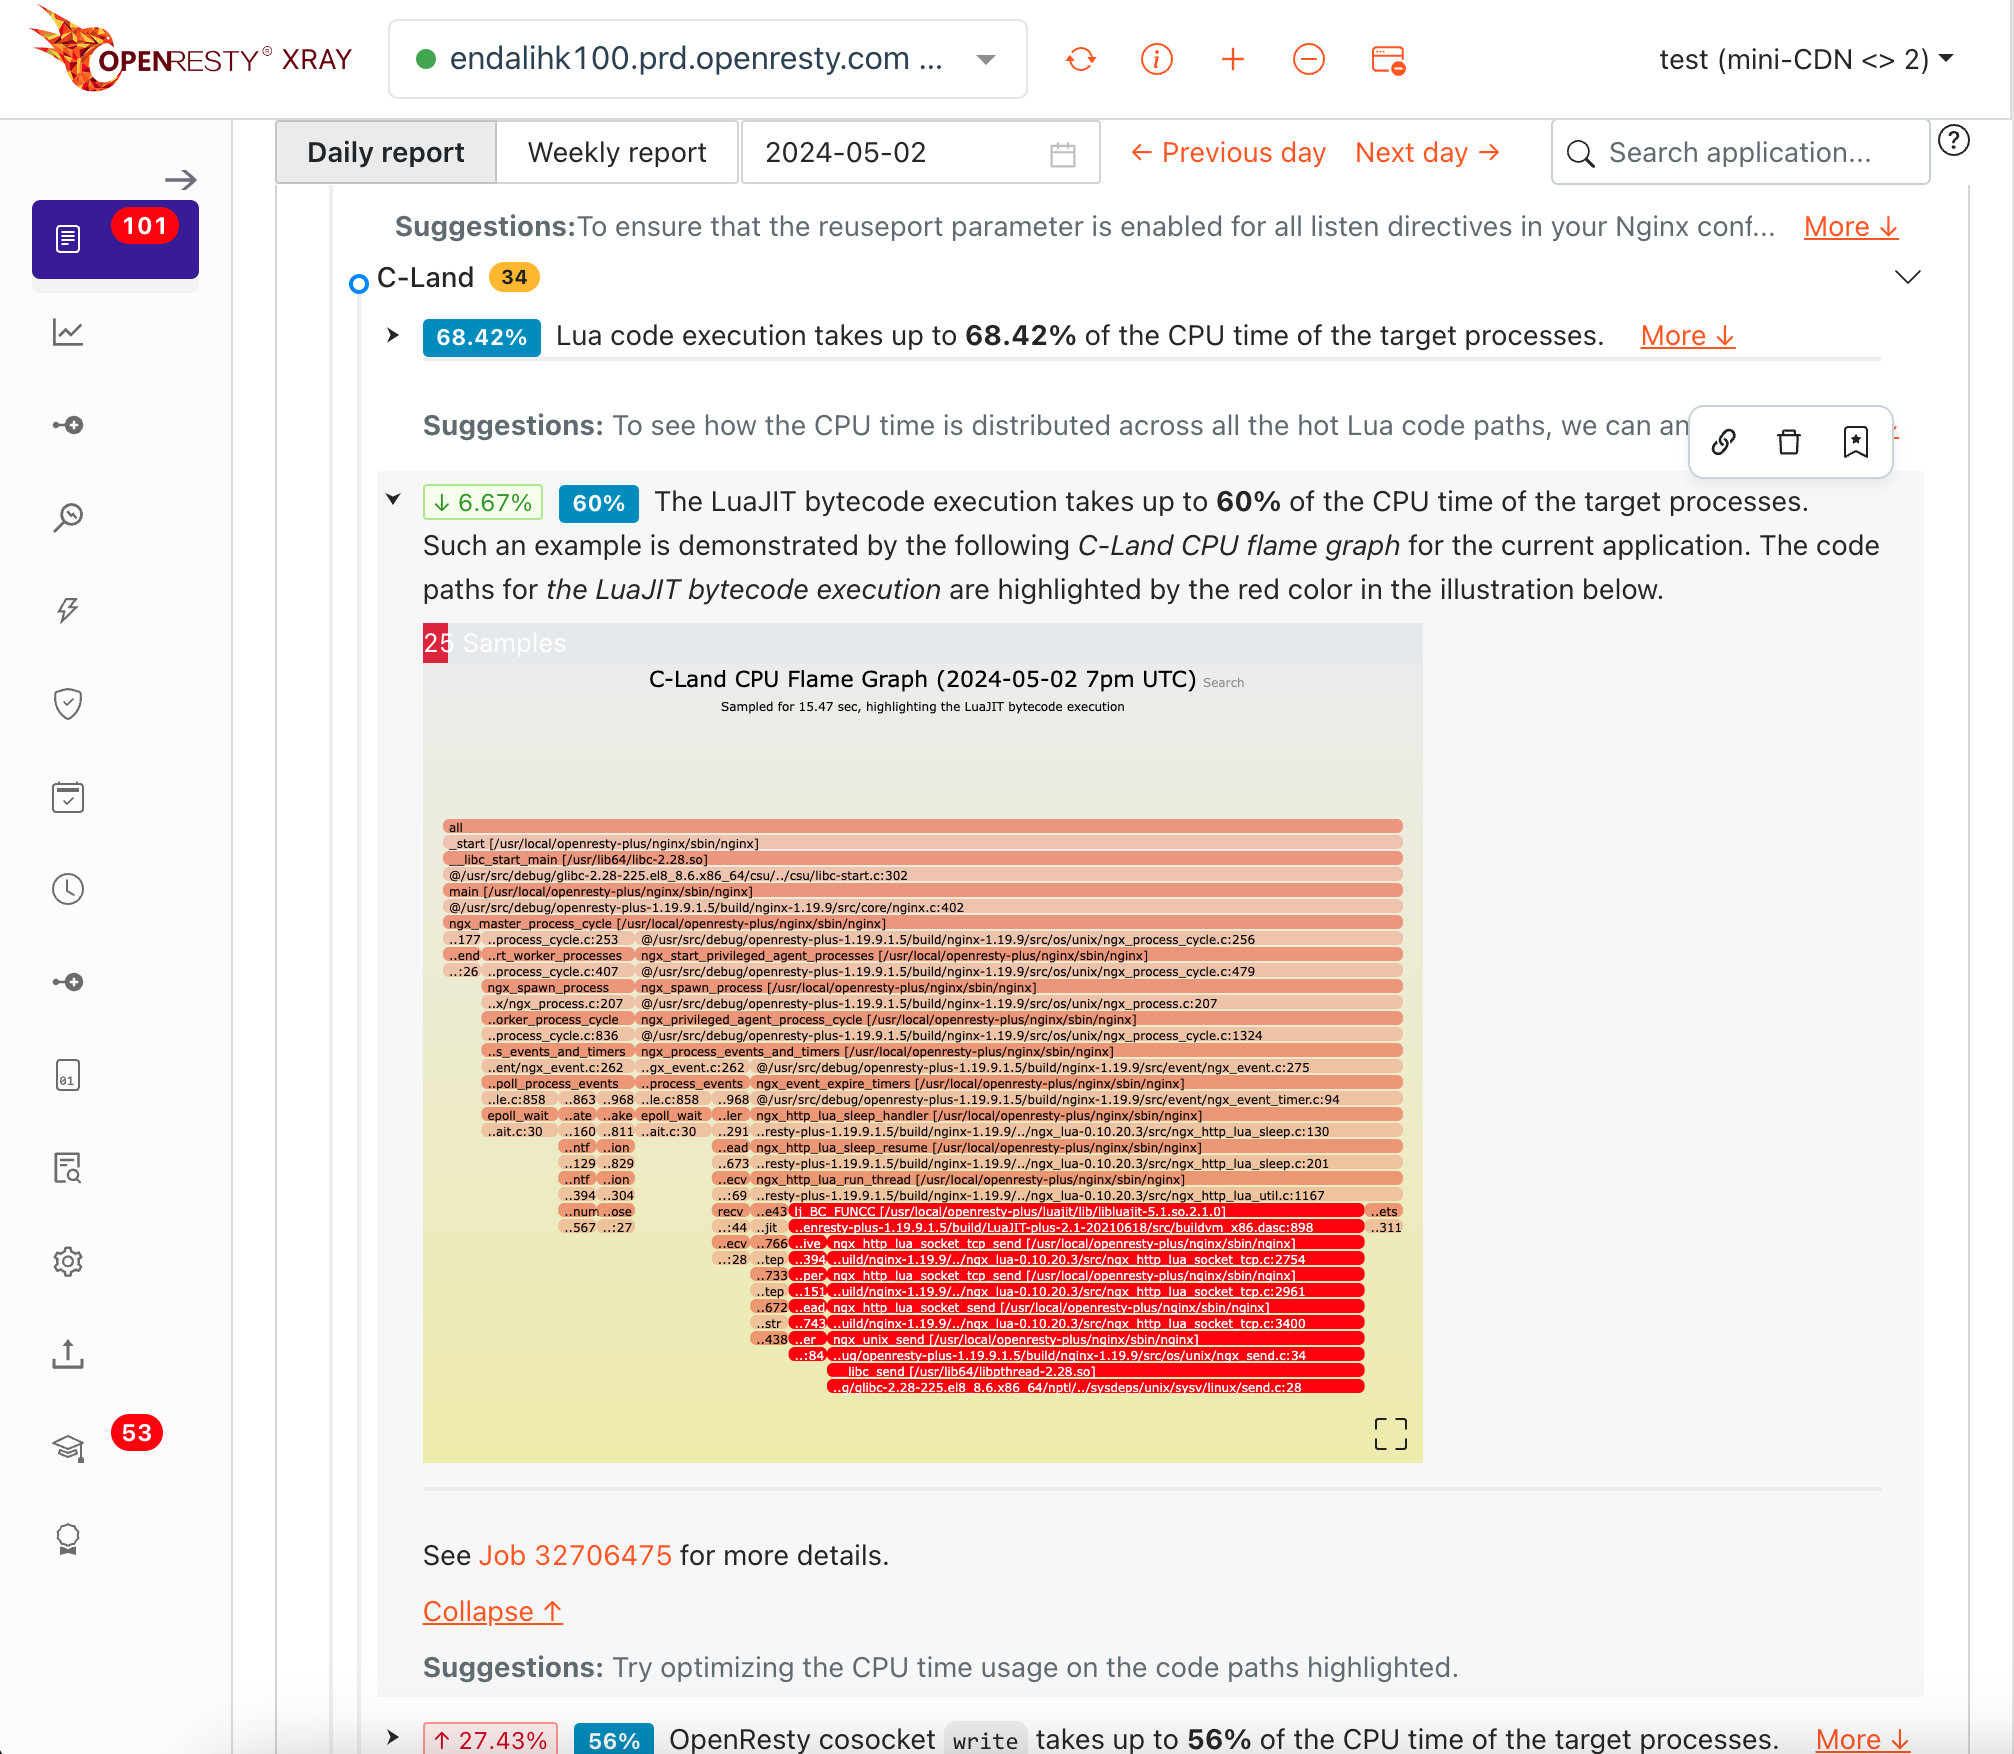

Watch your applications from any where, any time with the OpenResty XRay App for iOS and Android.
We use cookie to make your experience better. By clicking 'I agree' or continuing to use this website you're giving permission for cookies to be stored.
Learn more.

扫描二维码关注微信公众号
微信ID: openrestysoft